Whether it be the explosion of cryptocurrencies, a renewed fervor for SPACs[1], Electric Vehicle companies (many of which sought SPAC IPOs), or the dawn of the “Meme Stock”, it hasn’t been hard to find corners of speculative excess. Now that we’ve seen the market begin to correct nearly all of the most obvious examples, it’s worth asking how we got here and quantifying the staggering amount of capital that’s been burned.
The chart below is a that now have accumulated losses of over $1B, many of which have lost more in aggregate than their entire current market cap.

Source: Bloomberg data from 1/1/2015 (where applicable) to 8/31/22. List includes any US domiciled public company that has IPO’d since 2015 with over $1B in Accumulated Losses (negative retained earnings) and has yet to return any capital to shareholders.
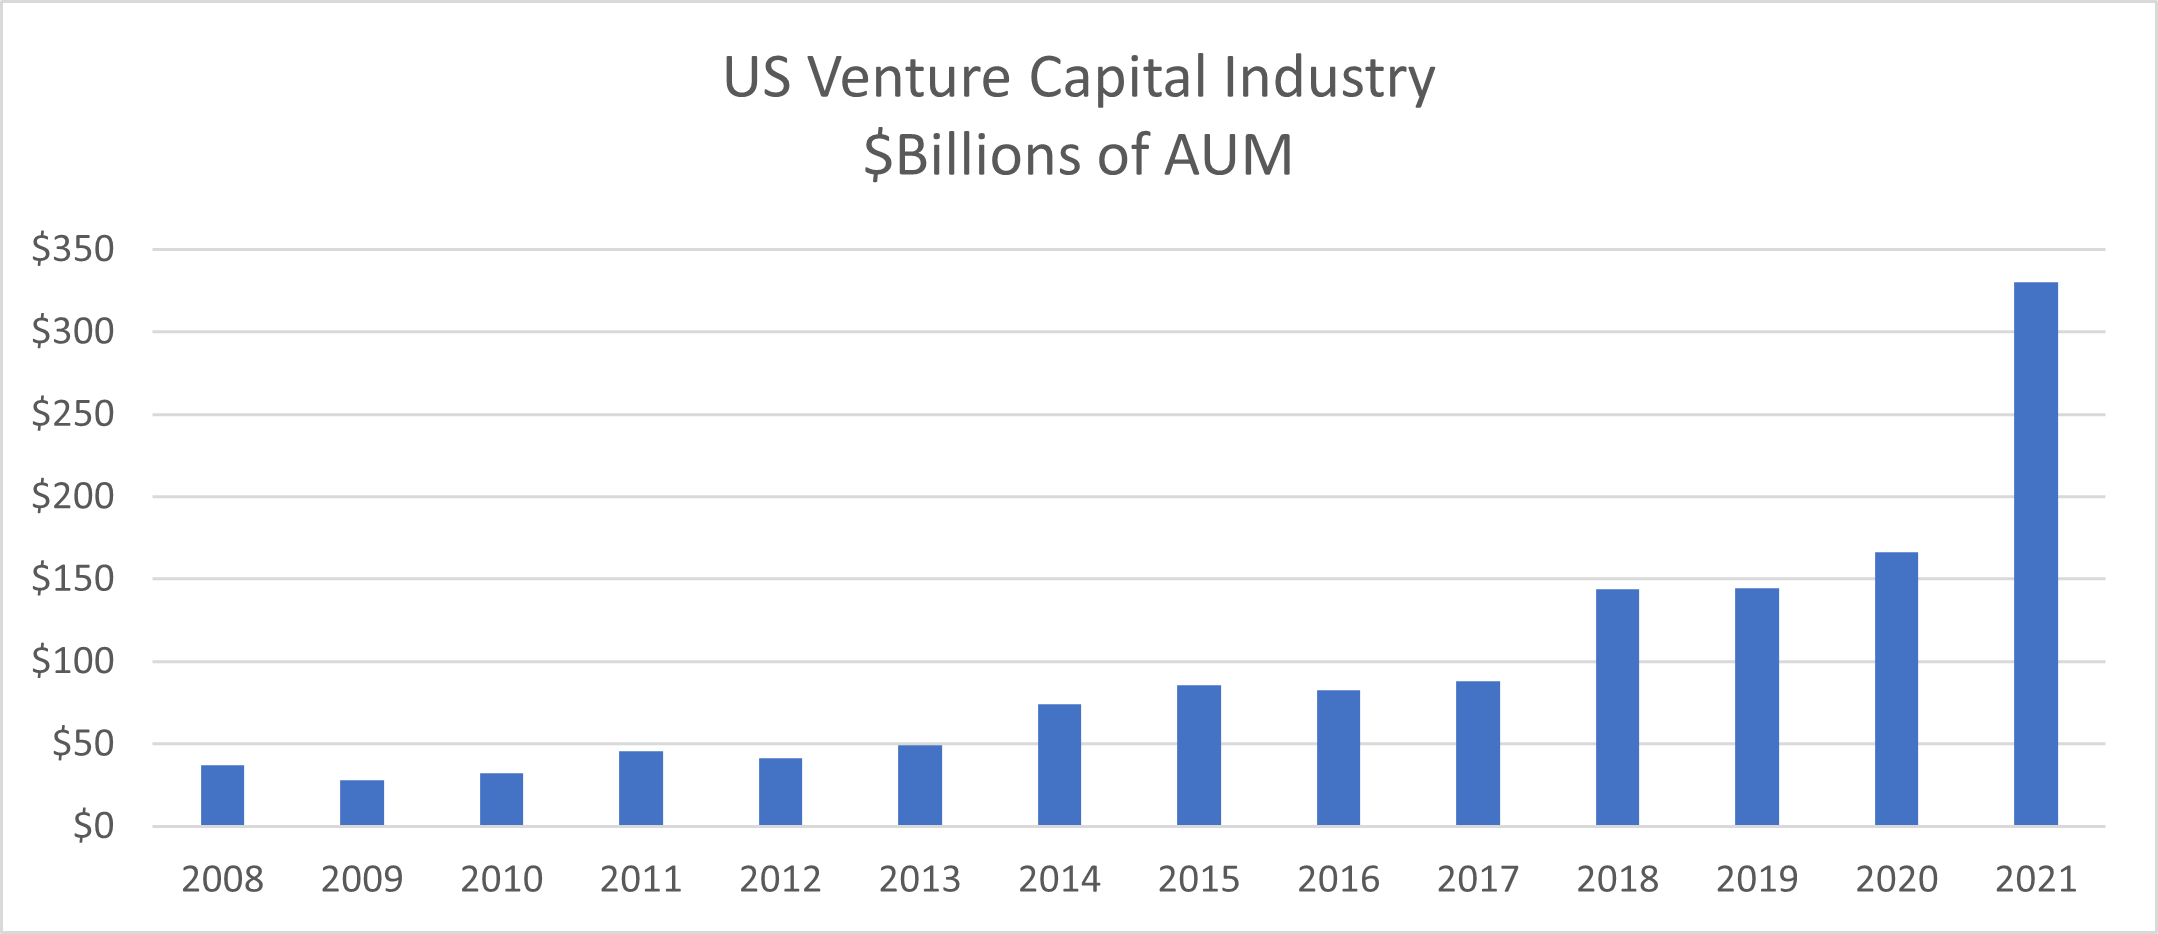
Any bubble requires a confluence of factors to emerge—and this one was no exception—but if one were looking for a scapegoat, the Venture Capital industry is an easy place to point a finger. Buoyed by general risk-taking and the performance of Technology companies after 2008, Venture Capital saw a massive influx of capital – capital they wouldn’t collect fees on unless it was put to work.

Source: PitchBook[2]
This huge influx of capital surely had positives (capital is the engine of capitalism after all), but excess capital inevitably runs out of attractive investment opportunities and investors ultimately force it into more dubious investments. Widespread availability of private capital allowed companies to stay private longer than they had in the past. In the same way one might play “hard to get” with a love interest, this delayed cycle built demand amongst public market investors who were desperate to get a piece of the giant companies built with venture funding.

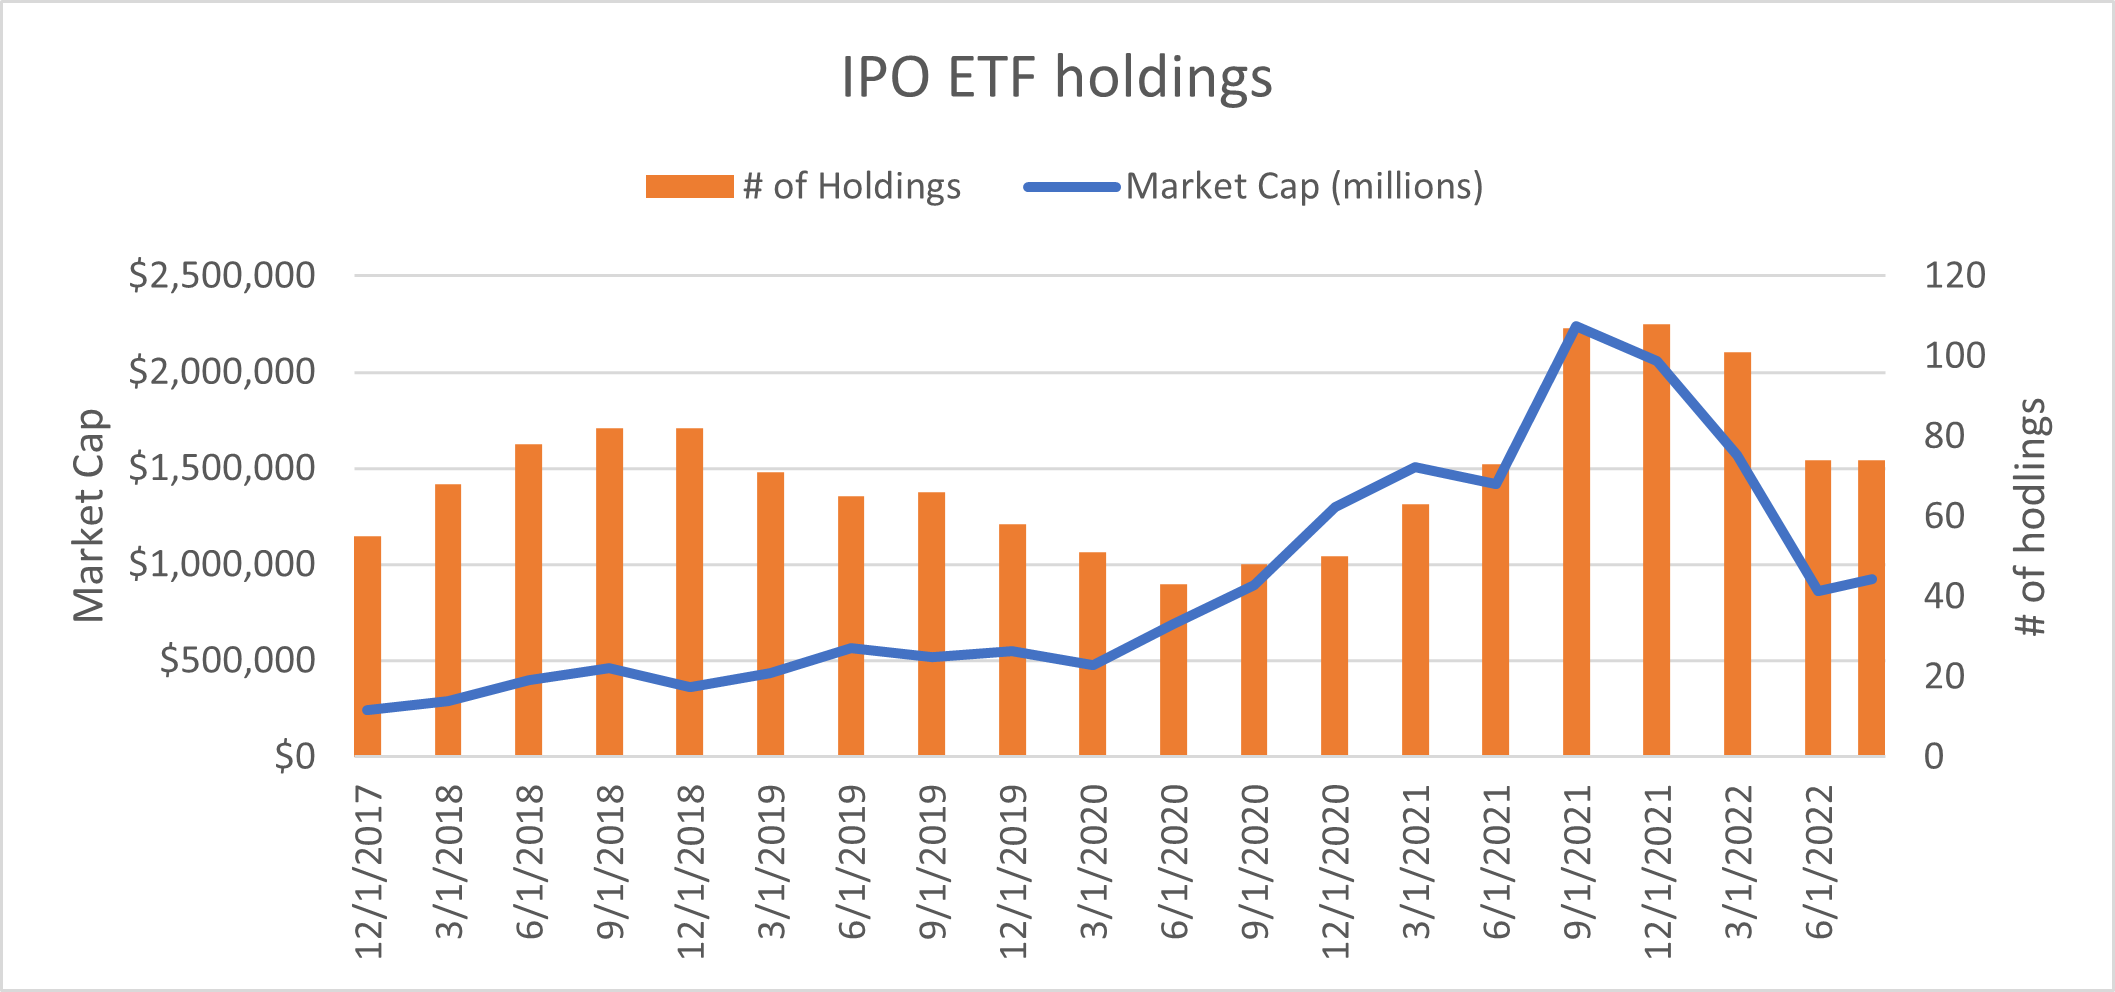
Bloomberg data on “IPO” US IPO ETF from Renaissance Capital, data from 12/31/17 to 8/30/22
As these companies inevitably went public, demand from risk-seeking public investors was insatiable as the chart above shows. The average market cap of the Renaissance IPO Index ETF shot from just over $4B in 2018 to a peak of over $25B as we entered 2021. Perhaps the pinnacle of the IPO mania came at the end of 2021 when Rivian (RIVN) was able to raise nearly $12 Billion with under $1 Million in revenue [3]. Despite reaching a market cap of around $120 Billion, Rivian would eventually trade down close to the $12 Billion it raised and had in cash on its balance sheet—all over the course of a few months.
A major theme of our investment process is pattern recognition—we believe human investors are also pattern recognizers both in their success at recognizing the same favorable investment set-up as well as their common bias in falsely applying a past pattern to a new situation. One likely explanation for why Venture Capitalists and other risk seeking investors were happy to plow capital into early-stage Tech firms was the massive success of the prior generation’s internet platforms. These new internet titans created the mentality of “winner-take-all” economics for any would-be platform business. With that mental framework, it’s easy to justify a huge up front and ongoing spend to drive growth as there is a massive prize when/if scale is ultimately achieved.
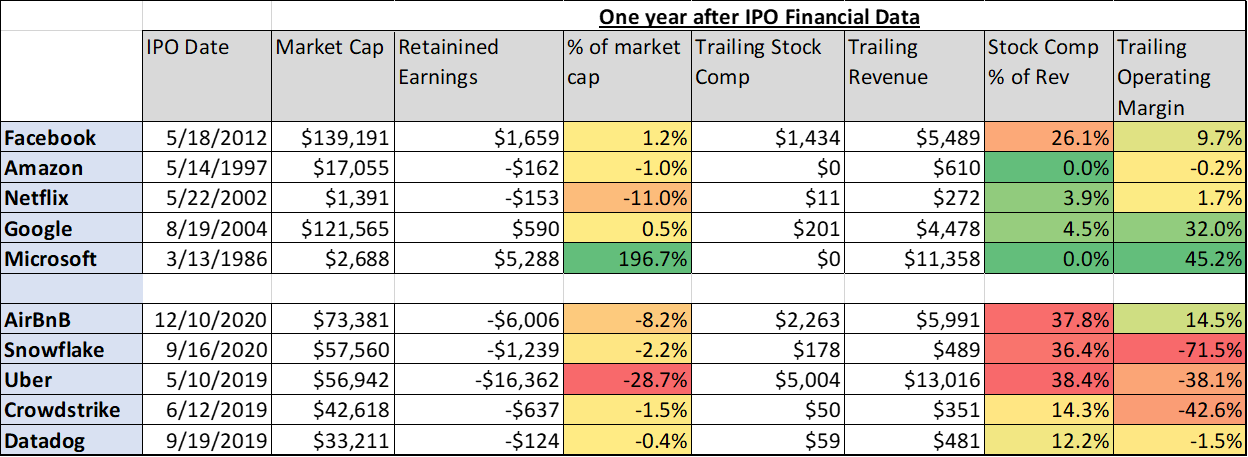
Conversely, today’s giant tech platforms are remarkable businesses and undoubtably difficult to emulate rather than representing consistent repeatable patterns to be exploited. Although both Netflix and Amazon have often had slim or nil accounting profits throughout their history, and Netflix in particular was heavily funded with debt, both of these companies amassed enormous physical assets with the capital they spent. Netflix has created one of the world’s largest digital content libraries in a fraction of the time of its incumbent competitors while Amazon has built not one but two separate capital-intensive businesses. Their FAANGM peers that operate more capital-light businesses generally had attractive financial profiles at a young age and burned a scant amount of investors’ capital on their way to market leadership.

Source: Bloomberg, chart shows the financials of each business one year after its IPO date. These are different time periods for each company and not current financials. Apple is excluded because its IPO (1980) is so much earlier than the others we didn’t deem it a useful comparison.
All of this is in stark comparison to the largest recent Tech IPOs which were exclusively loss-making and have amassed large cumulative deficits in their early histories. Generally, these losses were incurred to incentivize customers rather than build physical assets which may make them even riskier endeavors.
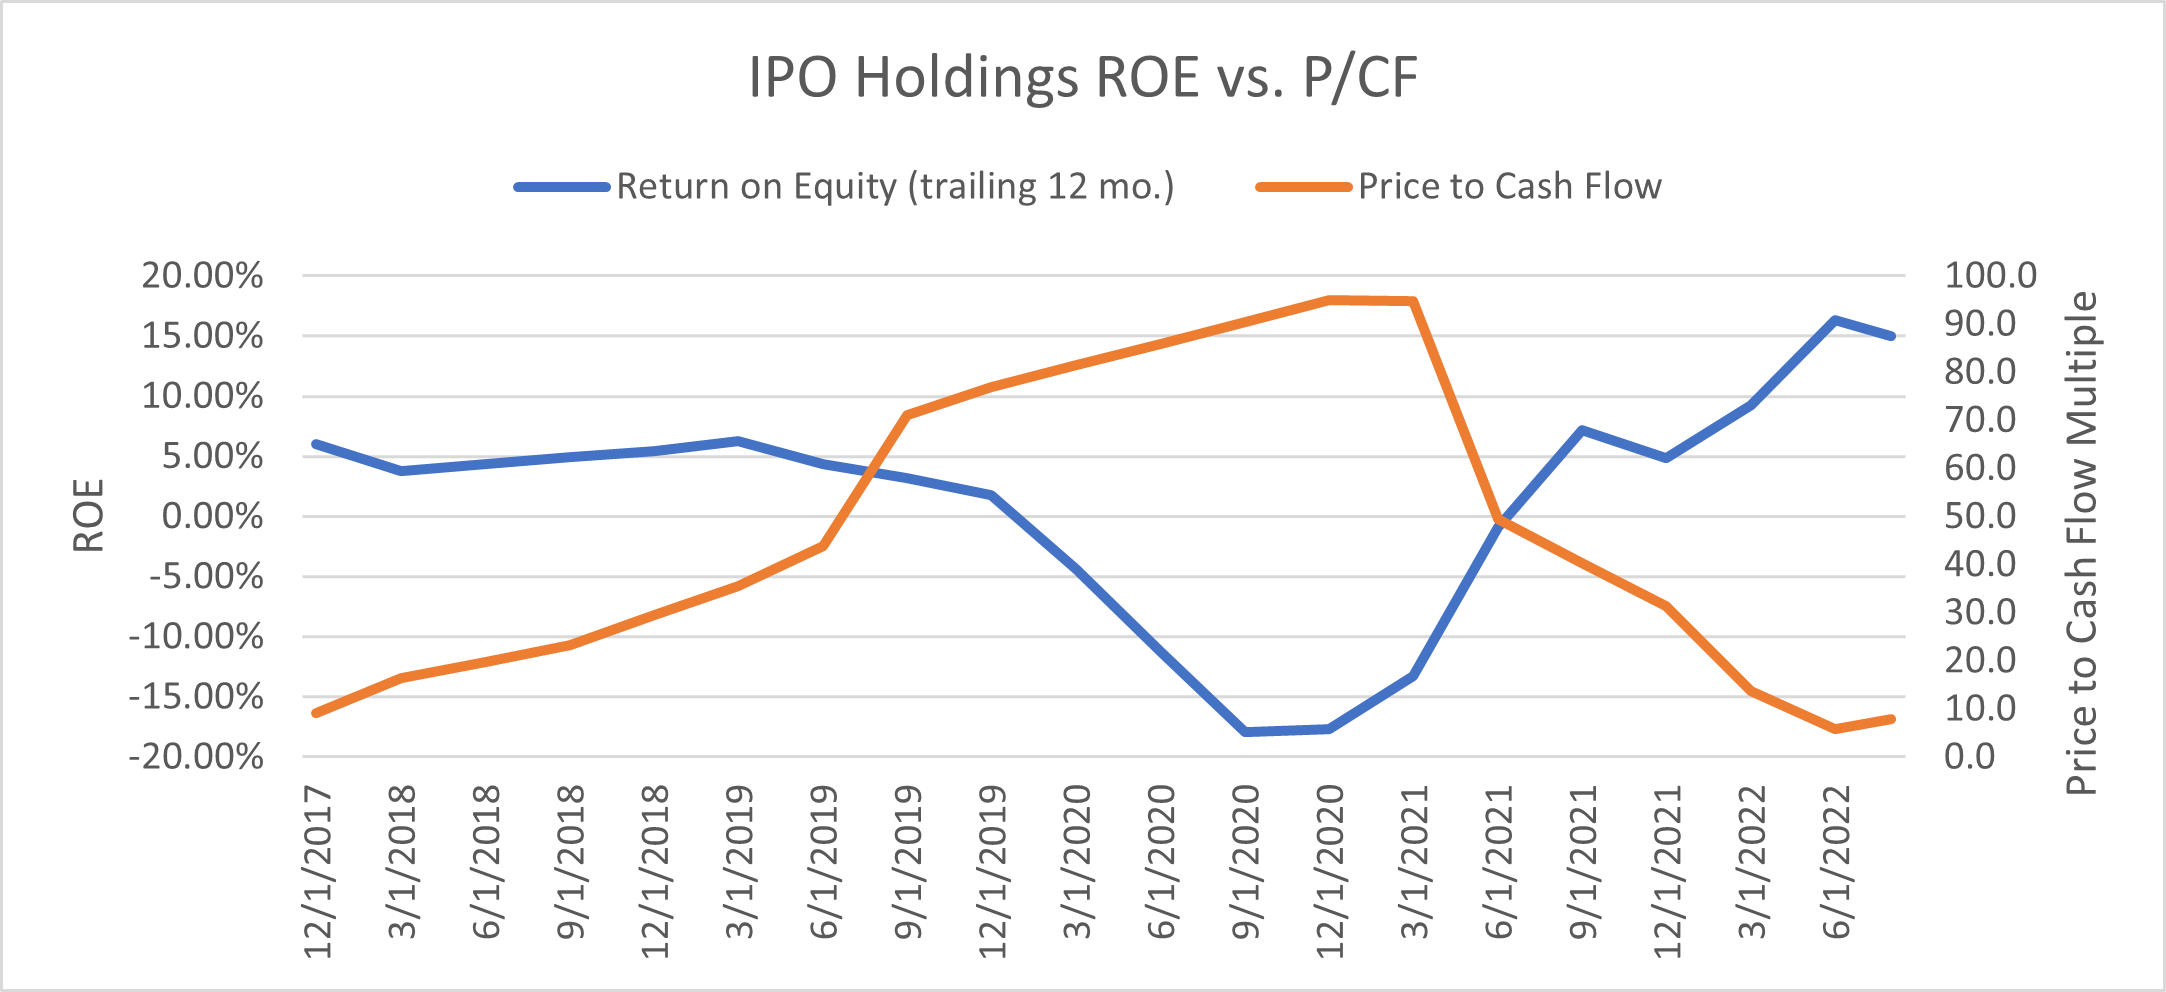
However, as I noted at the start of this post, the market has clearly changed. Years of excess have been mostly unwound in just months as the stock prices of the most financially precarious firms in the initial chart have fallen precipitously, and on average they are down -63% from their most recent high. The companies have followed the market’s lead as well, working quickly to rationalize. As the chart below shows, on the way up the market perversely paid more for young companies as they collectively delivered worse accounting returns. Now that the opposite is true, and the market is rewarding profits over growth, the businesses have adapted and are steadily improving their ROIs.

Source: Bloomberg, 12/31/2017 to 8/30/2022. The chart shows the aggregate return on equity for the trailing twelve months and the aggregate price to cash flow multiple of the underlying holdings with in the “IPO” ETF.
All of the firms listed above are now generating positive free cash flow (buoyed by generous stock-based compensation in many cases) and many are approaching true accounting profits as well. This period of forced rationalization should be an excellent time for investors to identify and profit from the true winners, while the companies with failed business models will likely continue to flounder now that their access to growth capital has been cut off. Although the aforementioned companies only represent one corner of the market we believe the overall implications for general risk-taking are widespread and the behavior of the aforementioned businesses to streamline and prioritize profits are not unique to them. We still haven’t “landed” but we believe this sea-change could make for a healthier total market going forward.
For more insights like these, visit BCM’s blog at
[1] SPACs are publicly traded companies built exclusively for the purpose of buying or merging with another company. Often known as “blank check” companies because they raise capital in advance of announcing an acquisition target, SPACs can be a clever way to IPO a private company with public investor capital. While this generally avoids the bureaucracy and fees of traditional investment bank led IPOs, there’s often hidden costs via dilution to the SPAC sponsor when a deal is approved. A cynical interpretation of the vehicle is that it provides a great way to quickly IPO a company without the regulatory scrutiny and diligence of a traditional IPO.
[2] The chart shows the dollar value of venture capital deals each year, the total AUM managed in the industry is estimated to be roughly $2Trillion. Source: Preqin
[3] Rivian investor relations, company fillings
Disclosures:
Copyright © 2022 Beaumont Capital Management LLC.
The charts and infographics contained in this blog are typically based on data obtained from third parties and are believed to be accurate. The commentary included is the opinion of the author and subject to change at any time. Any reference to specific securities or investments are for illustrative purposes only and are not intended as investment advice nor are they a recommendation to take any action. Individual securities mentioned may be held in client accounts. Past performance is no guarantee of future results.
Past performance is no guarantee of future results. Index performance is shown on a gross basis and an investment cannot be made directly in an index.
This material is provided for informational purposes only and does not in any sense constitute a solicitation or offer for the purchase or sale of a specific security or other investment options, nor does it constitute investment advice for any person. Nothing contained herein constitutes tax or legal advice. The material may contain forward or backward-looking statements regarding intent, beliefs regarding current or past expectations. The views expressed are also subject to change based on market and other conditions. The information presented in this report is based on data obtained from third party sources. Although it is believed to be accurate, no representation or warranty is made as to its accuracy or completeness.
As with all investments, there are associated inherent risks including loss of principal. Stock markets, especially foreign markets, are volatile and can decline significantly in response to adverse issuer, political, regulatory, market, or economic developments. Sector and factor investments concentrate in a particular industry or investment attribute, and the investments’ performance could depend heavily on the performance of that industry or attribute and be more volatile than the performance of less concentrated investment options and the market as a whole. Securities of companies with smaller market capitalizations tend to be more volatile and less liquid than larger company stocks. Foreign markets, particularly emerging markets, can be more volatile than U.S. markets due to increased political, regulatory, social or economic uncertainties. Fixed Income investments have exposure to credit, interest rate, market, and inflation risk. The individual securities mentioned herein are for illustration purposes only and are not to be considered a recommendation.
Diversification does not ensure a profit or guarantee against a loss.
The Renaissance IPO Index is designed to hold a portfolio of the largest, most liquid, newly0listed U.S. IPOs. Each quarter when the index is rebalanced, new IPOs are included and older constituents are removed. At quarterly rebalances, constituents are weighted by float-adjusted market capitalization with a cap imposed on any weightings exceeding 10%. The index serves as the underlying benchmark of the Renaissance IPO ETF “IPO”


