

Crude Oil Production Surges to Record High, the 10yr TIPS Yield Falls Deeper into Negative Territory, and a Look at What May Be In Store for the U.S. Economy
August 30, 2019 | FIRESIDE CHARTS
In today’s chart blog, we see crude oil production hit a record high, a projected recovery for lagging small caps, and try to catch a glimpse into the future. How long after a 10-2 year yield curve inversion have recessions typically begun, and will the soaring deficit—now expected to top $1 Trillion in 2020, per the CBO—hamstring government intervention when a recession does arrive? Meanwhile, negative-yielding debt continues to expand, and even the U.S. 10-year TIPS has gotten in on the trend.
While today’s economic news is largely mixed, our excitement for the holiday weekend is not: wishing you all a safe and happy Labor Day!
1. Does anyone remember the peak oil fears? Don’t bet against U.S. ingenuity!!
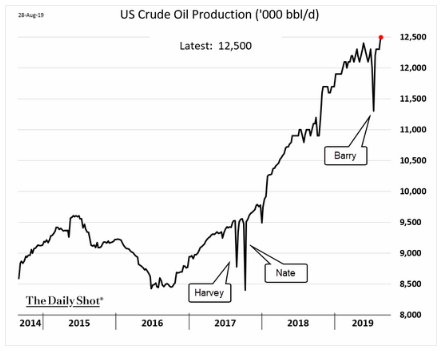
Source: WSJ Daily Shot, as of 8/29/19
2. Why have small caps lagged YTD? It is all about earnings…
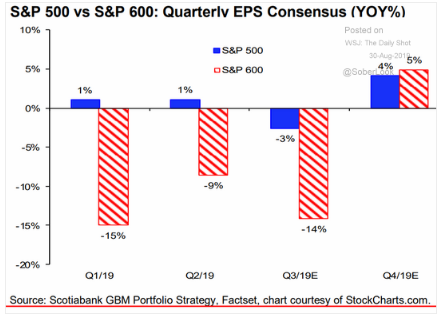
Source: StockCharts.com, as of 8/30/19
3. Is the August collapse in U.S. bond yields predicting a slowing economy? Well, our 2Q19 GDP was revised down to 2% and 3Q19 looks even weaker…
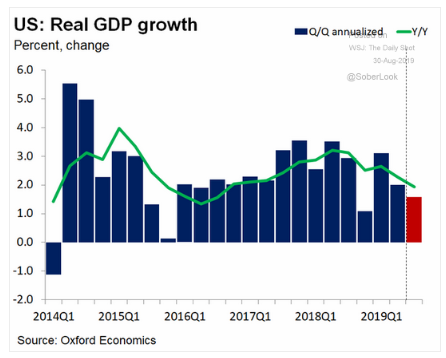
Source: Oxford Economics, as of 8/30/19
4. Historically, once the 10s-2s inverts, how long has it taken for the onset of a recession?
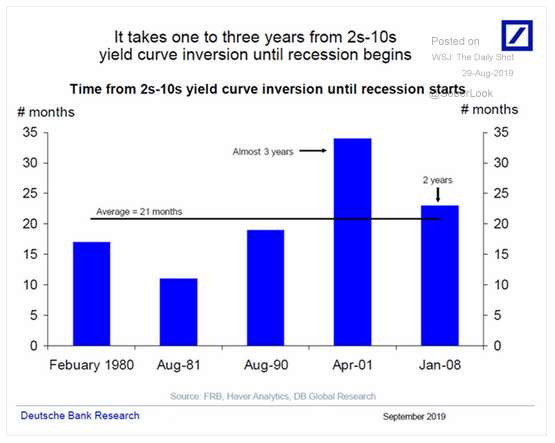
Source: Deutsche Bank Research, as of 8/29/19
5. Will this mean the next recession, whenever it arrives, will be particularly painful?
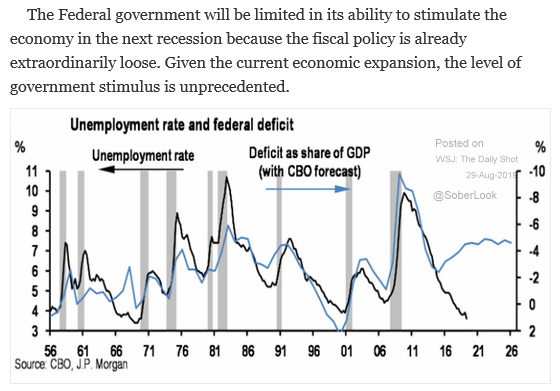
Source: CBO & J.P. Morgan, as of 8/29/19
6. After a yield curve inversion, another historical “sign” of a pending recession is the drop off in employment. Is Germany leading the way?
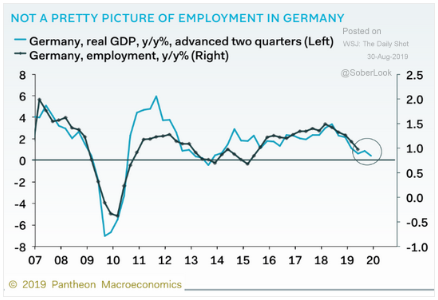
Source: Pantheon Macroeconomics, as of 8/30/19
7. The Federal German Government will make over 6 billion Euros this year by selling negative yielding debt. This is not rational long-term, but the markets can stay irrational for long periods of time!
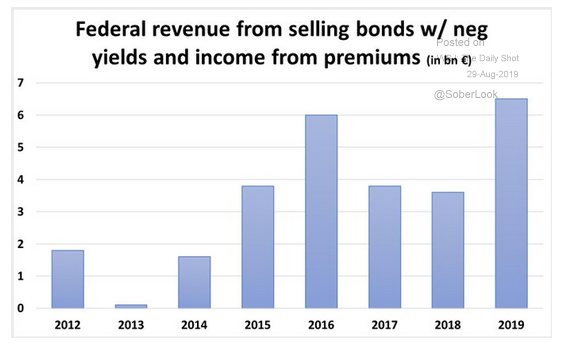
Source: WSJ Daily Shot, as of 8/29/19
8. And for those who doubt whether U.S. yields can go negative, it is already starting!
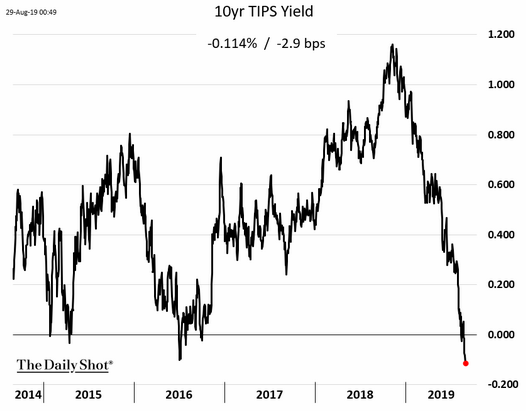
Source: WSJ Daily Shot, as of 8/29/19
9. As China lets the Yuan fall, other EM nations like Vietnam are seeing their currencies rise. Will the currency differential inhibit U.S. companies from shifting from China to other EM countries?
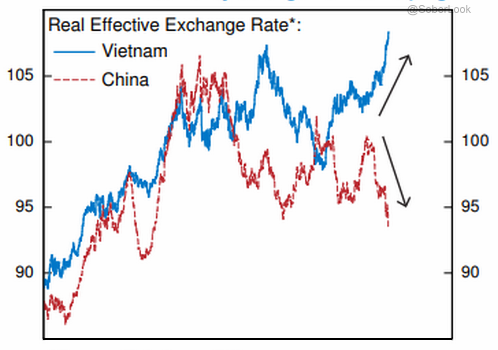
Source: J.P. Morgan, as of 8/29/19
10. Remember the Chinese tariffs targeted most of these red states…
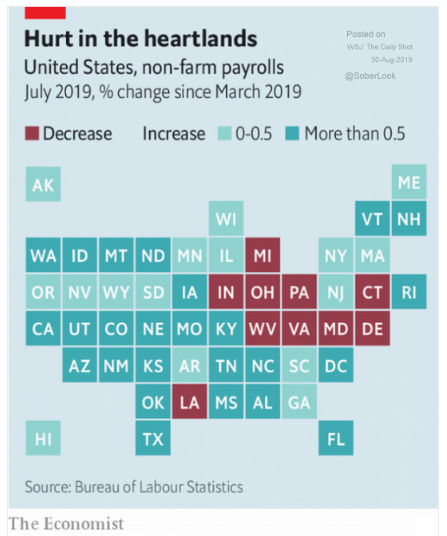
Source: The Economist, as of 8/30/19
11. Finally, a positive surprise out of Japan. We will watch the trend…
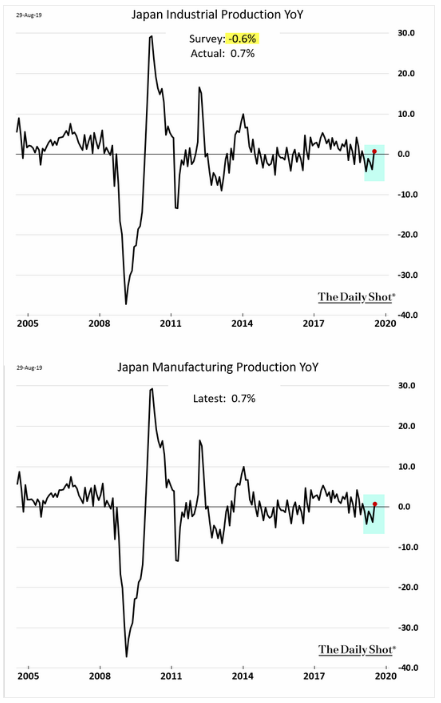
Source: WSJ Daily Shot, as of 8/30/19
More Articles You Might Like
Disclosure: The charts and infographics contained in this blog are typically based on data obtained from 3rd parties and are believed to be accurate. The commentary included is the opinion of the author and subject to change at any time. Any reference to specific securities or investments are for illustrative purposes only and are not intended as investment advice nor are they a recommendation to take any action. Individual securities mentioned may be held in client accounts. Past performance is no guarantee of future results.